Vinayak Nair/ AEROSPACE

Home/Projects/AeroFrame-DT

PRJ-08 · Structures / nonlinear FEA · documented study

AeroFrame-DT

A traceable design study for a forward pylon-to-wingbox attachment fitting, from parametric geometry and synthetic load definition to nonlinear finite-element evidence.

529.7 kN
System load envelope
5
e/D variants
1.7%
Scaling deviation
10
Frozen variables
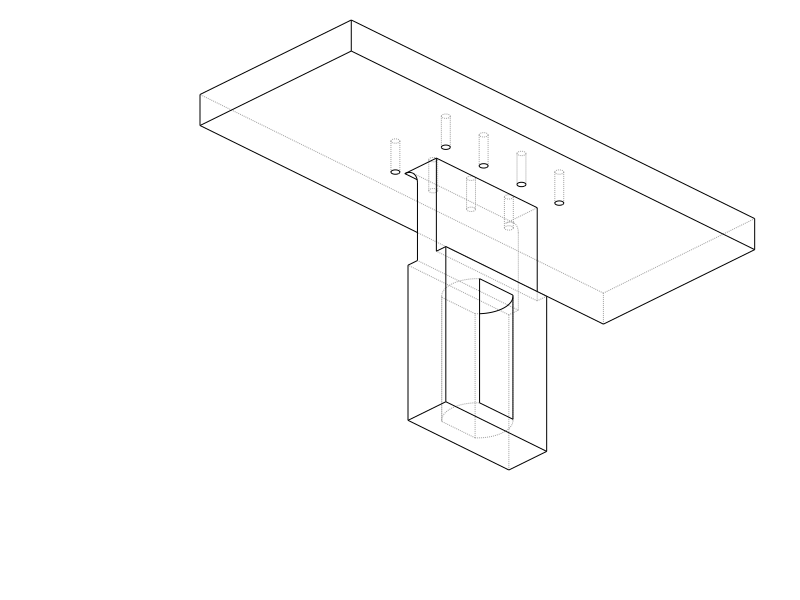
AF-DT-1000 / PARAMETRIC GEOMETRY Wireframe view of the AeroFrame-DT pylon-to-wingbox attachment fitting and fastener pattern. DATUM A / WINGBOX INTERFACE DATUM B / PIN AXIS

01Engineering question

A pylon attachment fitting has several plausible failure paths: bearing at the pin, net-section tension, shear-out through the free edge, local plasticity at the bore, and global compliance through the web and flange. A solver contour alone does not identify which model is trustworthy.

The project question was narrower and more useful: which geometric ratio actually controls the response, and which attractive-looking outputs should be rejected before they become claims?

Claim boundary

All loads and geometry in this study are synthetic, educational, non-OEM, and non-certified. The evidence demonstrates engineering process and judgment, not aircraft substantiation.

02Requirements

IDRequirementVerification
DT-001Geometry inputs shall be frozen and source-traceable before comparisonParameter schema + decision record
DT-002The design load shall be applied through the pin bore, not as a point loadFE model review
DT-003Hand calculations shall screen bearing, net section and shear-outIndependent calculation sweep
DT-004The edge-distance trade shall cover the mode transitionFive e/D configurations
DT-005Elastic cases shall track a simple stiffness estimateDeformation correlation
DT-006Plastic results shall be checked against the material-card implicationEquivalent plastic strain audit
DT-007Unresolved assumptions shall remain visibleOpen-item register

03Load basis

The Rev A screening envelope used representative transport-category conditions as rationale while keeping every magnitude explicitly synthetic. The propulsion-system load was distributed between forward and aft attachment stations for the first fitting-level estimate.

CaseDirectionFactorUltimateRole
LC-01Vertical +Z2.5 g × 1.5220.7 kNManoeuvre screening
LC-02Forward +X9.0 g529.7 kNGoverning system envelope
LC-03Lateral +Y3.0 g × 1.5264.9 kNSide-load screening
LC-04Combined transientDynamicDeferredFuture analysis
Pfwd, Rev A = 0.50 × 529.7 kN = 264.9 kN later Rev D geometry sweep shown in the plots: Psweep = 284.686 kN

The two values belong to different analysis configurations and are kept separate. The 50/50 split omits the pitching couple from propulsion-system CG offset, so it is a lower-bound screening assumption.

04Parametric geometry

Ten controlled variables tied the approved design envelope to the Python geometry, STEP deliverables, drawing package and FE variants. The baseline was authored in inches and converted to SI for calculation.

Primary lugREV A
Pin diameter2.000 in / 50.800 mm
Lug thickness1.500 in / 38.100 mm
Lug width4.000 in / 101.600 mm
Edge distance2.500 in / 63.500 mm
Interface + ratiosCONTROLLED
Flange / web25.400 / 19.050 mm
Blend radius12.700 mm minimum
Fastener pattern4 × 2, nominal 0.250 in
Ratiose/D 1.25 · W/D 2.00 · t/D 0.75

05Analysis models

Independent lug checks

σbearing = P / (D t) σnet = P / [(W - D)t] τshear-out = P / [2(e - D/2)t] MS = allowable / applied - 1

The two-plane shear-out expression is screening-only below the failure-regime transition. It does not capture the full shear-out / hoop-tension interaction.

FE correlation checks

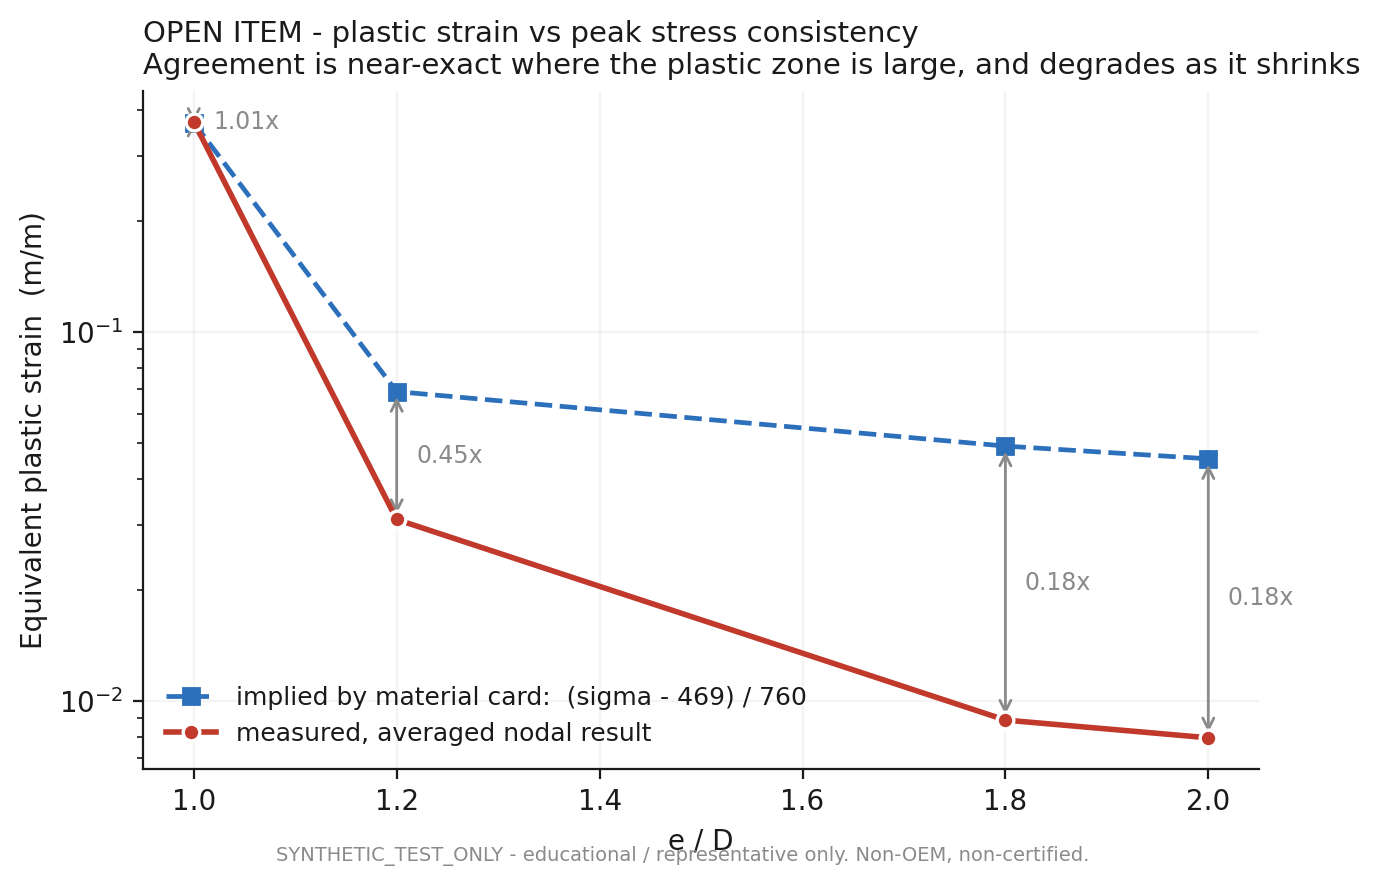
δshank = P L / (A E) εp, implied = (σvm - 469 MPa) / 760 MPa acceptance logic: elastic deformation trend ↔ simple axial stiffness plastic strain field ↔ material-card implication
Configuration control

The Rev A decision record names representative 7075-T7351. The later sweep plot identifies 7075-T651 with Ftu = 517 MPa and Fsu = 303 MPa. They are not blended into one certified allowable basis; the material-basis distinction remains explicit.

06Finite-element setup

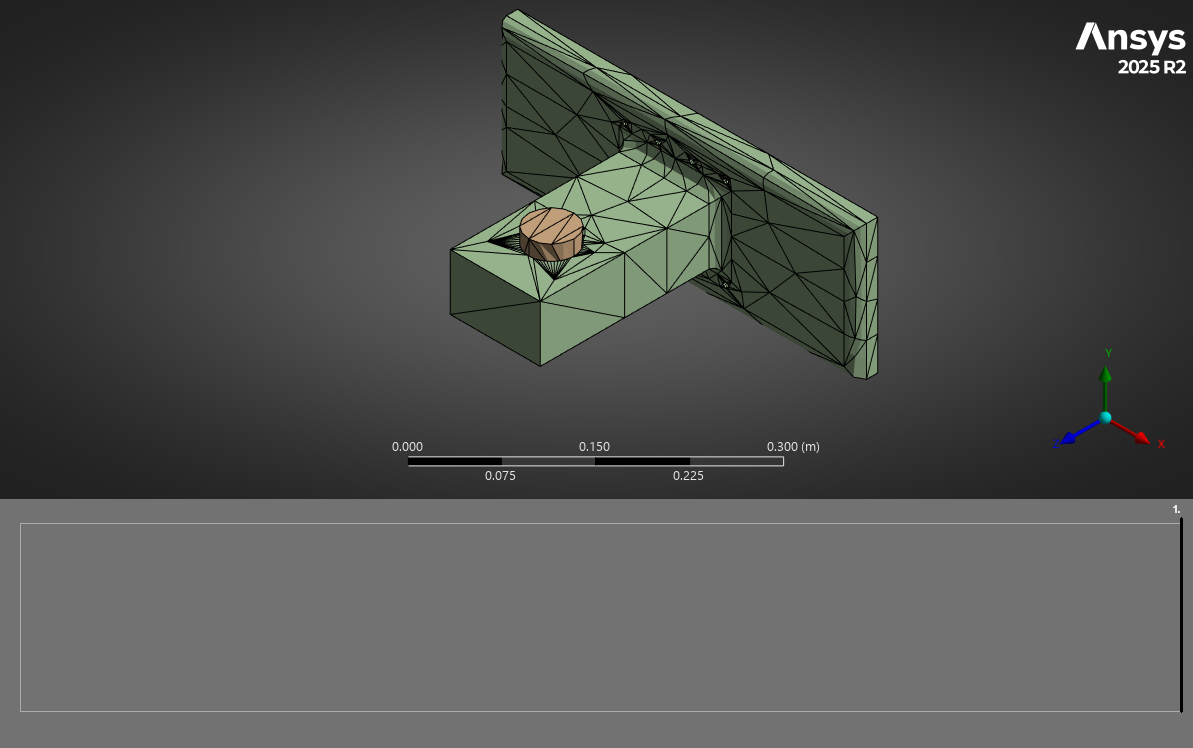
ANSYS finite-element mesh of the pylon fitting, pin and wingbox interface with local bore refinement.
Fig. 1Solid mesh and pin interface. Local element density increases at the bore and web transition.
Model controls
  • Load introduction. Bearing load transferred through the modeled pin and bore instead of a concentrated point force.
  • Critical region. Mesh refinement follows the bore, ligament and web-to-flange blend where gradients are expected.
  • Variant control. The e/D parameter changes while load, diameter and thickness remain controlled within the sweep.
  • Nonlinear evidence. Stress and plastic-strain outputs are evaluated together rather than treating peak stress as an elastic margin.

07Validation

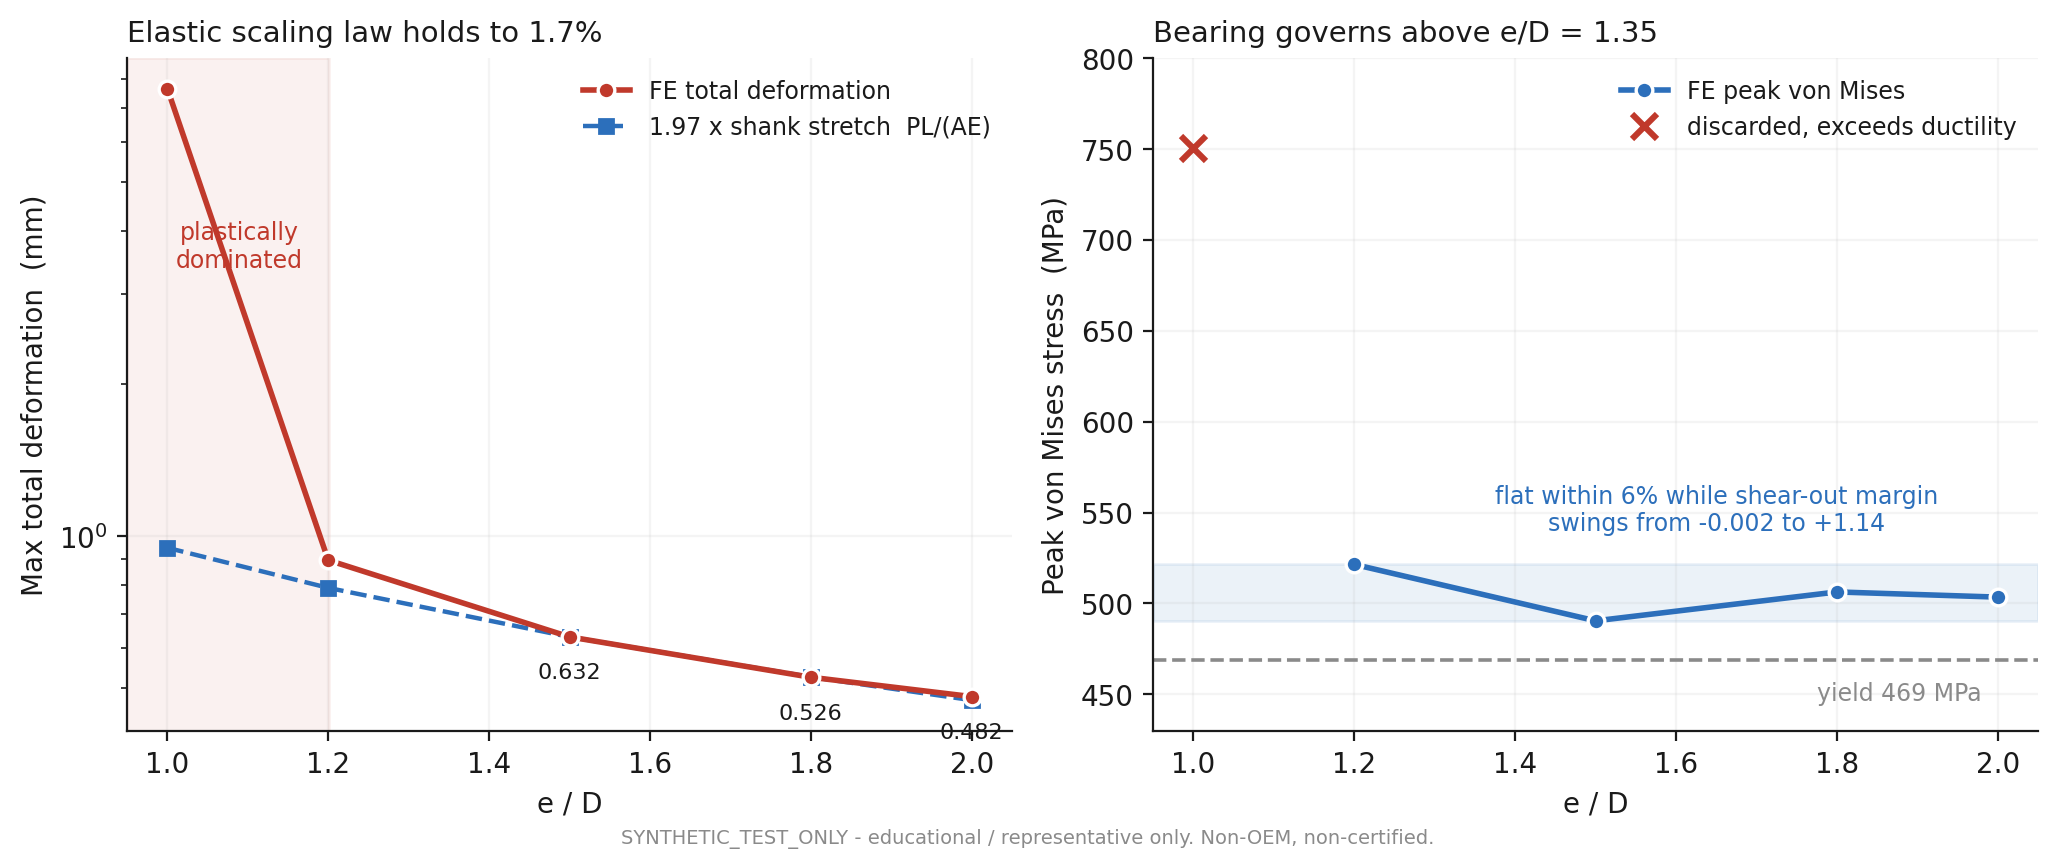
Two-panel plot comparing total deformation and peak von Mises stress across five edge-distance ratios.
Fig. 2FE response across the e/D sweep. Elastic configurations follow the expected stiffness trend; the e/D 1.0 case is discarded for exceeding the ductility model.
1.7%
Elastic trend deviation
490–522
MPa, e/D 1.2–2.0
1
Variant discarded
  • Elastic deformation follows 1.97 times the simple shank-stretch estimate to within 1.7%.
  • Peak von Mises response remains comparatively flat from e/D 1.2 through 2.0 even as the simplified shear-out margin changes strongly.
  • The e/D 1.0 point is not used as a design result because the response exceeds the material model's ductility range.

08Results

Margin-of-safety curves for shear-out, bearing and net section plotted against lug edge-distance ratio.
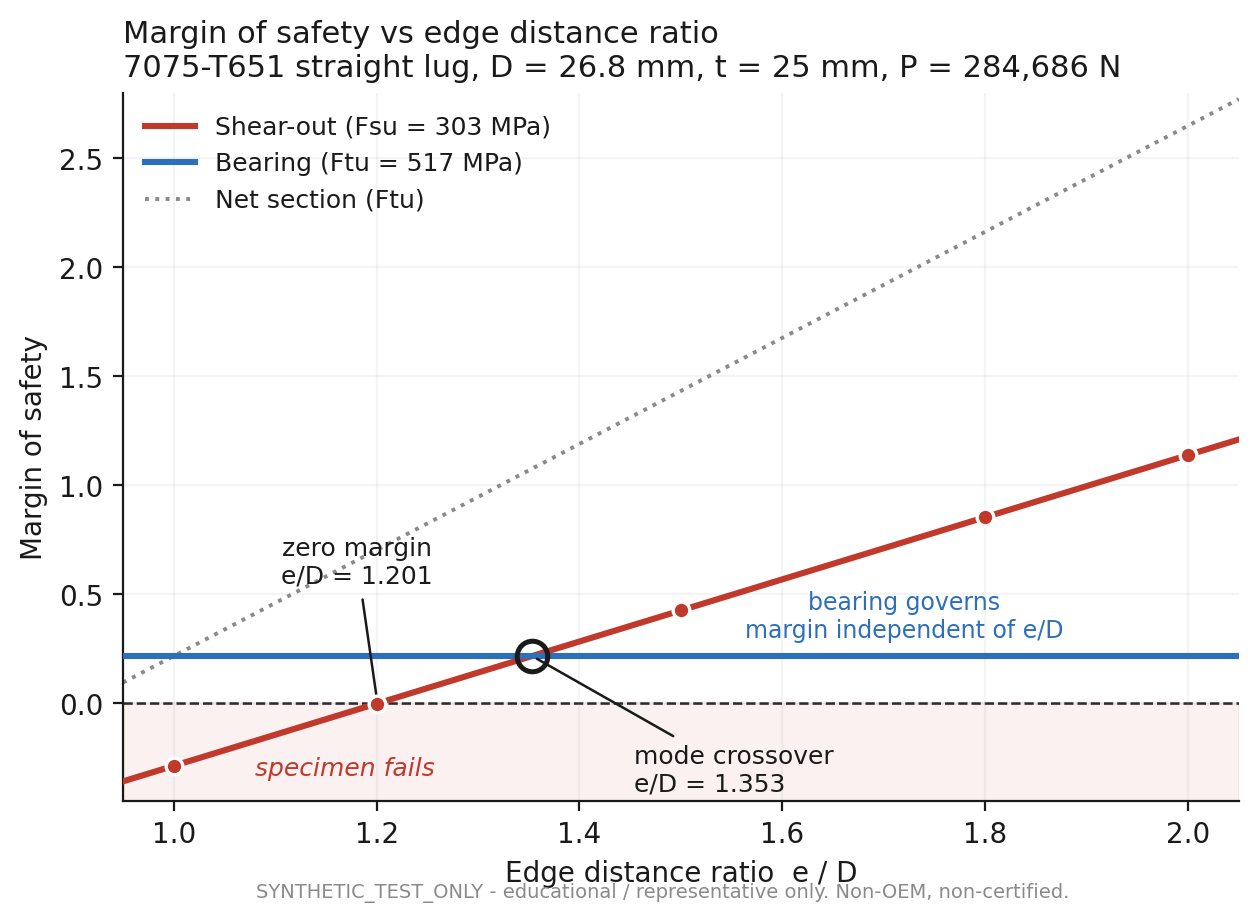
Fig. 3Hand-calculation sweep. Simplified shear-out crosses zero near e/D 1.201; the mode crossover occurs near e/D 1.353.
Zero margin
e/D 1.201

Below this point, the screening shear-out expression predicts failure.

Mode crossover
e/D 1.353

Above the crossover, added edge distance no longer improves the governing bearing mode.

Bearing margin
~ +0.22

Approximately constant across the sweep because projected bearing area does not depend on e.

What the result changed

The edge-distance rule stopped being treated as a binary geometry-validity test. It became a failure-regime flag that determines which analysis method can govern.

09Recorded engineering decision

Retain the Rev A baseline at e/D = 1.25

The original constraint logic rejected any geometry below 1.5D. Review of the lug method showed that 1.5D is approximately a boundary between failure regimes, not a universal physical-validity floor. The actual physical floor is a positive ligament, e > D/2.

QuestionDecisionConsequence
Increase edge distance?No, retain 2.500 in / e/D 1.25Avoid mass and drawing rework that do not improve the limiting mode
Keep 1.5D as a hard failure?No, convert it to a regime flagAutomation reports analysis-method risk instead of rejecting valid geometry
Allow simple shear-out to govern?No, screening only below the transitionK-coefficient lug analysis plus solid FEA required
Fatigue-critical location?Pin bore retainedReduced edge distance carried into fatigue follow-on work

10Verification record

The portfolio page is downstream of the project evidence. The artifacts below existed before this presentation and carry the assumptions, configuration and solver state.

ArtifactWhat it provesState
PARAMETER_SCHEMA.csvTen controlled geometry values with decision-source IDsSet
LOAD_BASIS_AF-DT-1000_revA.mdFour-case envelope, load split, claim boundary and open load-path itemApproved
DECISIONS_AF-DT-1000_revA.mde/D decision, analytical limits and binding follow-on workRecorded
AF-DT-1000_fitting_revD_mm.stepReleased parametric solid in analysis unitsRev D
revdconverged.wbpzArchived ANSYS model and solver stateArchived
fig1 / fig2 / fig3Hand-check sweep, FE trend correlation and plastic-strain auditEvidence

11Limits and open findings

Load pathHighest priority

The 50/50 station split excludes the pitching couple from propulsion-system CG offset. The fitting load is therefore a screening lower bound, not a final substantiation load.

Plastic strainOpen

Measured nodal plastic strain agrees with the material-card implication when the plastic zone is large, then falls to roughly 0.18 times the implied value as the zone shrinks.

AllowablesOpen

No certified basis is frozen for material product form, thickness or grain direction. T651 and T7351 references remain configuration-specific.

Peak contourDiagnostic

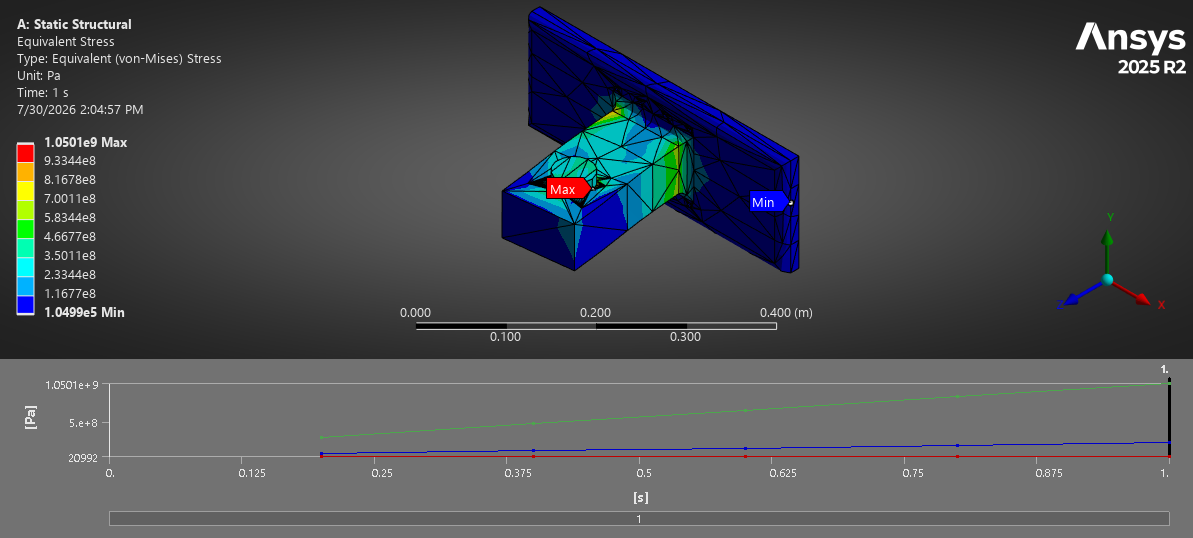
The separate contact-model screenshot reports a 1.05 GPa maximum. Because that exceeds yield and is hotspot-sensitive, it is shown as load-path evidence, not quoted as a final margin.

Equivalent plastic-strain consistency plot comparing measured nodal values with values implied by the material card.
Fig. 4Open plastic-strain consistency finding. Agreement degrades as the plastic zone becomes small.

12Lessons learned

  • A screening rule is not a law of physics. The 1.5D threshold became useful only after it was reframed as a failure-regime transition.
  • Trend agreement is stronger than one contour. Five controlled variants revealed what stayed flat, what scaled, and what became nonphysical.
  • Configuration differences belong in the result. Loads, materials and geometry revisions are kept separate rather than blended into a cleaner story.
  • An unresolved inconsistency is evidence too. The plastic-strain mismatch is visible because it changes what can be claimed.
  • Traceability makes the portfolio credible. Every headline number maps to a calculation, solver artifact or recorded decision.

14Next work

  1. Define the actual forward/aft station geometry and propulsion CG offset, then replace the 50/50 split with a free-body solution including the pitching couple.
  2. Freeze one material allowable basis with product form, thickness, grain direction and statistical basis.
  3. Resolve the nodal averaging and integration-point recovery behind the small-zone plastic-strain mismatch.
  4. Run a formal bore-region mesh-convergence study and separate structural stress from contact singularity.
  5. Carry the accepted geometry into fatigue and tolerance-stack assessments at the pin bore.